

Lebanon’s failing electricity system places an unequal burden on households, as wealthier families use solar and backup power to escape shortages while poorer households consume less electricity and leave more of their basic energy needs unmet.
The hidden tax of Lebanon’s electricity crisis
The hidden tax of Lebanon’s electricity crisis
By Chelsea Al Arif | August 13, 2026

Reading time: 6 min
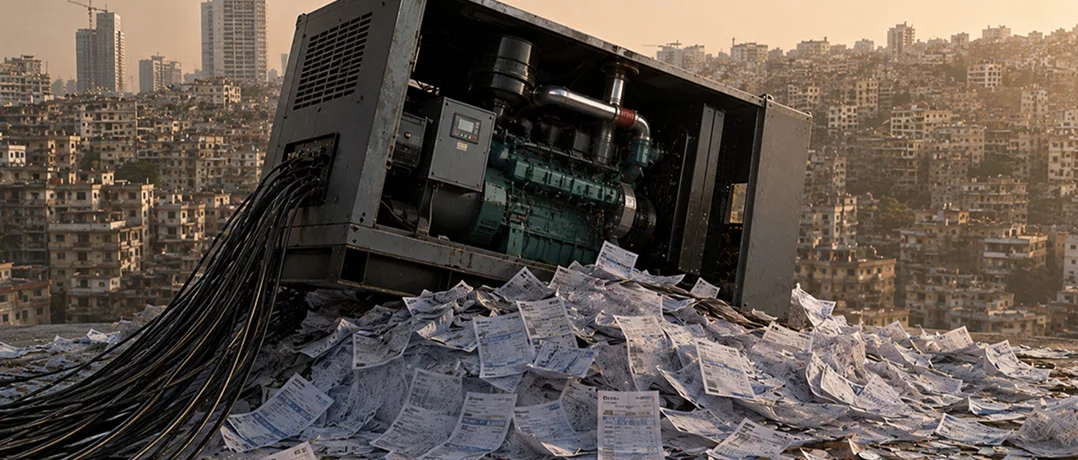
Lebanon has no electricity tax. But households are paying a substantial share of their income to replace electricity the public grid does not reliably provide.
Based on recent estimates of household spending on backup electricity, those costs would amount to roughly 22% to 38% of estimated annual household gross income, before EDL electricity is added. The calculation uses an estimated annual household income range of between $3,600 and $6,100, reflecting the scarcity of reliable national income statistics.
The reverse lies less in who pays the largest bill than in who can afford to escape the shortage. Higher socioeconomic-status households can invest in larger solar and battery systems that preserve more of their electricity use, while lower-status households consume less electricity and report greater unmet demand. The burden therefore appears not only in money paid, but in electricity people cannot afford to use.
96% connected, 73% on diesel, 58% on solar
Researchers from Lebanon, Norway and Austria surveyed approximately 1,000 Lebanese households between March and July 2025. More than 96% of those households maintained an EDL subscription. Yet 73% also had access to diesel generation and 58% had a solar photovoltaic system.
In other words, connection to EDL has not eliminated the need to purchase another source of electricity. Reliance on private supply intensified after Lebanon’s financial collapse. EDL, which historically relied on imported oil for around 95% of its electricity generation, saw availability fall to as little as two hours per day after the 2019 crisis as fuel-import constraints worsened. Neighbourhood diesel generators continued operating as informal microgrids, while households increasingly installed solar panels and batteries.
The 35% solar gap
Median solar capacity among high socioeconomic-status households was 22% larger than among middle-status households and 35% larger than among low-status households. Battery capacity followed the same pattern.
The obstacles to installing solar also differed across socioeconomic groups. For low-status households, the main barrier was lack of funds. For wealthier households, physical limitations such as available rooftop space became more important. Among middle- and higher-status households without solar, 36% cited at least one physical obstacle, including insufficient space, poor solar exposure or neighbourhood restrictions.
The distinction matters because larger solar and battery systems allow households to generate and store more electricity independently.
The findings suggest that households without the capital to make those investments are more likely to remain dependent on diesel generation or suppress their electricity consumption.
The diesel figures point in the same direction. Among households connected to generators, electricity consumption from diesel generation increased with socioeconomic status. Households with both solar and diesel were generally less reliant on diesel than those depending exclusively on generators.
Higher-status households therefore do not necessarily spend less money on electricity. In absolute terms, they may spend more. The inequality lies in what that spending allows them to secure.
Low-status households use around 8 kWh less a day
The clearest difference is in electricity consumption itself. Low socioeconomic-status households consumed 8.9 kilowatt-hours less electricity per day than high-status households in the researchers’ initial model, while middle-status households consumed 4.2 kWh less.
Even after adjusting for household characteristics including number of rooms, number of residents and dwelling size, the gap remained substantial: approximately 8.1 kWh per day for low-status households and 3.6 kWh for middle-status households. Both differences were statistically significant.
Lower consumption, however, cannot automatically be interpreted as lower electricity need.
65.8% report unmet electricity demand
65.8% of households reported an unmet electricity demand. The proportion of unmet demand generally declined as socioeconomic status increased across different backup arrangements. Households combining solar and diesel recorded some of the lowest levels, while households relying on only one source faced larger gaps.
That matters because electricity spending alone does not capture the full household burden. A family that cannot afford to run an air conditioner does not generate an air-conditioning electricity bill. A household that stops using an electric heater similarly appears to consume less electricity.
The appliance data shows that heating and cooling equipment were among the appliances most frequently owned but left unused. Households also reorganise when they consume electricity. Solar-owning households recorded their daily peak electricity use earlier than households dependent exclusively on diesel, shifting consumption towards the period of strongest solar generation at around 1 p.m. Statistical testing found the difference significant for both solar-only and hybrid households compared with diesel-only users.
Consumption therefore reflects not only how much electricity households want, but how much their backup system enables them to use. There is also a limitation at the bottom of the socioeconomic distribution. Unmet demand refers to additional electricity a household would consume if reliable EDL supply became available at existing prices. For some poorer households, even that additional grid electricity may remain unaffordable. Their potential electricity needs can therefore fall outside the measure altogether.
41% of potential solar power goes unused
At the same time that some households suppress electricity consumption, another part of Lebanon’s replacement system has the capacity to produce electricity that households cannot use or export.
Among solar-only households, at least 41% of potential solar generation is curtailed on average, according to the researchers. That represents more than 2.4 megawatt-hours of potential electricity per solar-only household every year.
The problem is partly structural. Lebanon has enacted a renewable-energy law allowing distributed generation to feed electricity back into the system, but implementation remains pending. Without an operational mechanism for selling or transferring excess production, locally available solar electricity can go unused.
The result is an electricity economy capable of producing scarcity and surplus at the same time: some households report electricity they cannot afford to consume, while others have potential generation they cannot transfer elsewhere.
Taken together, the figures describe a system in which access to reliable electricity is increasingly determined outside the public grid. Nearly every surveyed household remains formally connected to EDL, yet private capital increasingly shapes how effectively households can compensate for its failures.
Those with greater resources can invest in larger solar arrays, batteries and hybrid systems that preserve more of their electricity use. Those with fewer resources are more likely to adjust by consuming less and leaving more demand unmet.
The reverse tax is visible less in who writes the biggest cheque than in who can afford to escape the shortage.
In Lebanon’s replacement electricity economy, poorer households do not necessarily pay the most in dollars. They pay through the electricity they cannot afford to use.
That is where the tax runs in reverse.
