



Using global production data and trade figures, The Beiruter traces the geography connecting the world’s farms to a concentrated network of fertilizer producers.
The hidden geography of the world’s food

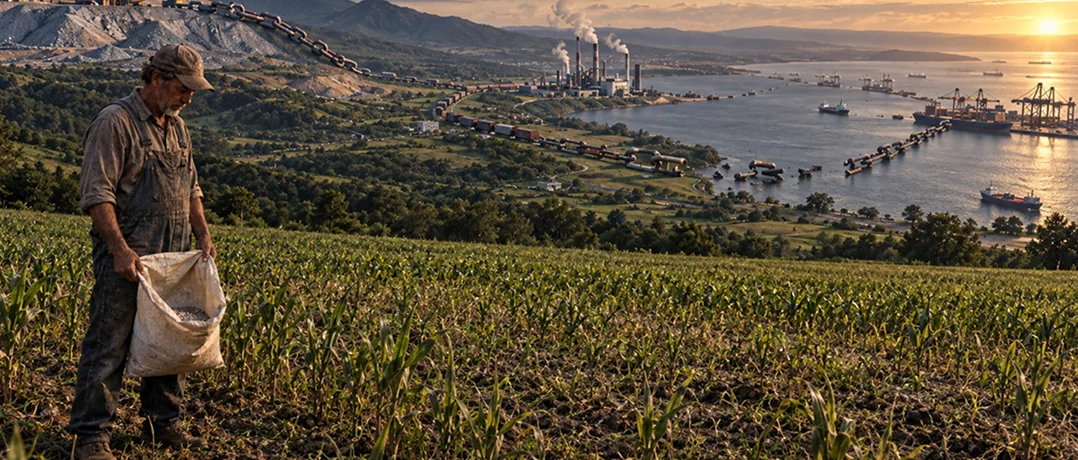
The world’s food supply depends on three nutrients whose production is concentrated in remarkably few places. In 2025, five countries produced roughly 62% of the world’s ammonia, 77% of its phosphate rock and 82% of its potash, according to the U.S. Geological Survey data. Yet the farms that depend on nitrogen, phosphorus, and potassium span almost every region of the world.
Brazil is one of the clearest examples of the imbalance. Its farms used roughly 22.1 million tonnes of the three nutrients in 2024, making it the world’s third-largest user in UN Food and Agriculture Organization (FAO) data. But domestic consumption tells only part of the story. To measure the scale of fertilizer arriving from abroad, The Beiruter analyzed the FAO’s 2024 fertilizer data for every country with sufficient figures, subtracting exports from imports for each nutrient and comparing the resulting net inflow with the amount used by its farms. In Brazil, net imports were equivalent to 98% of nitrogen use, 70% of phosphorus use and 97% of potassium use.
The mismatch ties the economics of farming to a very different map from the one on which food is grown. Disruptions to fertilizer production or the trade routes carrying it can travel thousands of kilometers before appearing as higher costs on a farm, making the geography of these essential nutrients an overlooked source of vulnerability in the global food system.
The geography beneath the farm
Nitrogen, phosphorus and potassium perform related roles on a farm but have fundamentally different origins. Nitrogen fertilizer is produced from energy-intensive ammonia, commonly made using natural gas, while phosphorus and potassium come largely from mined phosphate rock and potash deposits. Nitrogen production can therefore develop where energy and industrial capacity permit. Phosphorus and potassium are more tightly bound to geology.
The difference is visible in where each is produced. China made about 49 million tonnes of ammonia measured by nitrogen content in 2025, while India and Russia each produced 15 million tonnes, according to the U.S. Geological Survey’s (USGS) Mineral Commodity Summaries 2026. The Beiruter calculates from USGS data that those three countries supplied roughly 49% of global production, rising to 62% for the five largest producers.
Phosphate rock is considerably more concentrated. China produced an estimated 110 million tonnes in 2025, followed by Morocco with 36 million and the United States with 20 million. Together they accounted for roughly two-thirds of world production, rising to about 77% with Russia and Jordan included, according to The Beiruter’s calculations from USGS data.
Current production, however, obscures an even more striking imbalance in where future supplies lie. Morocco holds an estimated 50 billion tonnes of phosphate-rock reserves, nearly 69% of the 73 billion tonnes reported worldwide by USGS, despite accounting for only about 14% of production in 2025. Phosphorus, critically, has no substitute in agriculture.
Potash narrows the geography further. Canada produced 15 million tonnes measured in potassium oxide equivalent in 2025, followed by Russia with 10 million, China with 6.3 million and Belarus with 6 million. Those four countries accounted for roughly 76% of world production. Add Germany, the fifth-largest producer, and the share rises to about 82%, according to The Beiruter’s calculations from USGS data.

Production of the three principal fertilizer inputs is concentrated among a small number of countries, particularly phosphate rock and potash. Shares calculated by The Beiruter from U.S. Geological Survey estimates for 2025.
These differences impose distinct limits on how easily each supply chain can diversify. Nitrogen can be manufactured wherever sufficient energy, industrial capacity and investment exist. Countries cannot create major phosphate or potash deposits where none exist.
When farms depend on fertilizer from elsewhere
Those supply constraints take on greater significance when fertilizer production is compared with where the nutrients are actually used.
The FAO data analyzed by The Beiruter show that exposure to foreign supply can differ substantially even within the same country. China’s farms used about 42.7 million tonnes of nitrogen, phosphorus and potassium in 2024, the largest combined amount in the dataset. China exported more nitrogen and phosphorus than it imported, but the picture reversed for potassium. Its net potassium imports were equivalent to roughly 87% of the amount reported as agricultural use.
India, the second-largest user, consumed approximately 32.9 million tonnes across the three nutrients. Net imports were equivalent to about 20% of reported nitrogen use and 31% of phosphorus use. For potassium, however, India imported 2.54 million tonnes and exported less than 19,000 tonnes while reporting agricultural use of approximately 2.38 million tonnes.
Brazil stands apart because substantial foreign inflows extend across all three nutrients. Its farms used 7 million tonnes of nitrogen, 6.2 million tonnes of phosphorus measured as P₂O₅ and 8.9 million tonnes of potassium measured as K₂O in 2024. Imports after exports were subtracted amounted to approximately 6.9 million tonnes of nitrogen, 4.4 million tonnes of phosphorus and 8.6 million tonnes of potassium.

Potassium import reliance varies widely across countries, revealing the gap between where potash is produced and consumed. The Beiruter analysis of FAOSTAT fertilizer data for 2024. Credit: FAO. 2026. FAOSTAT: Fertilizers by Nutrient. Accessed 22 September 2026. Licence: CC BY 4.0.
The figures measure the scale of foreign supply rather than the literal share spread on fields. Fertilizer can be imported in one year and used in another, held in inventories, processed into other products or subsequently exported. FAO also combines national reporting with estimates where observations are incomplete. Net imports can therefore sometimes exceed recorded agricultural use.
The comparison nevertheless reveals how differently countries are positioned within the global fertilizer system. Even major farming economies can depend heavily on nutrients produced elsewhere, exposing their costs to distant supply and trade disruptions.
When distance becomes vulnerability
International trade connects fertilizer-producing regions with the farms that depend on them. That system works because nutrients can travel vast distances, but those distances become a source of vulnerability when production or trade is disrupted.
In early 2026, one of the world’s most important fertilizer-exporting regions collided with one of its most important shipping chokepoints. Disruptions around the Strait of Hormuz sharply curtailed Middle Eastern fertilizer exports, hitting nitrogen markets particularly hard. The Middle East had accounted for almost a quarter of global urea exports in 2024 and more than 15% of ammonia exports, according to the World Bank’s Commodity Markets Outlook.
Urea prices averaged $725 a tonne in March 2026, up nearly 55% from February and their highest level since April 2022. The World Bank’s fertilizer price index rose more than 12% in the first quarter and reached its highest monthly level since 2022 in March. In its April outlook, the bank projected fertilizer prices would rise by more than 30% in 2026, including a nearly 60% increase in urea prices.
The pathway from a disrupted shipping lane to a food market is not immediate. Higher fertilizer prices first raise costs for farmers. Producers can absorb those costs, pass some of them along, switch products or reduce application. The consequences therefore vary by crop, country and season. But fertilizer is one of the channels through which disturbances far from agricultural regions can reach the economics of producing food.
A map that can change only so much
The geography of fertilizer supply is not fixed. Fertilizer supply can diversify through new factories and mines, alternative trade routes and more efficient nutrient use.
The International Fertilizer Association’s Medium-Term Fertilizer Outlook 2026–2030, published in May, expects additions to global fertilizer supply over the remainder of the decade. USGS similarly projects world potash production capacity to rise from 66.1 million tonnes of K₂O in 2025 to 77.4 million tonnes by 2029, with much of the increase expected from new mines and expansions in Laos and Russia.
Phosphate production capacity is also expected to grow. USGS projects global capacity measured by P₂O₅ content to rise from 63.7 million tonnes in 2025 to 71.7 million tonnes by 2029, with expansions underway in Brazil, Kazakhstan, Mexico, Morocco and Russia.
Yet diversification eventually runs up against geology. Countries can build ammonia plants where energy and capital permit. They cannot create major potash or phosphate deposits where none exist.
Investment can diversify fertilizer supply, but it cannot erase its underlying geography. As long as essential nutrients originate in fewer places than the farms that need them, disruptions in a relatively small number of countries will continue to influence the cost of producing food worldwide.
-
-

-
The Beiruter
-
